Are you an instructor who’s thought, “I have all this content that my students need to know—why aren’t they getting it”? Have you considered converting that bland text into a format that pops? Let’s discuss why you should consider using visual tools to bring your information to life.
Why would you want to use a visual tool like an infographic? According to Educause, an “infographic” displays a lot of data and ideas with images from simple to complex in a visually appealing online format that can be interactive.
Converting your content requires the following steps:
- Start by analyzing your content to determine what format you are going to use. You want to make sure that it is meaningful and relevant to the topic at hand.
- Ask yourself: “what are the instructional objectives?” Are students required to remember facts and concepts to build a foundation so that they can later connect, elaborate, synthesize, and apply it to other information? This was my situation when I created the history infographic below. Bloom’s Digital Taxonomy is a useful tool for considering instructional objectives. Bannister (2002) also provides useful tools for Developing Objectives and Relating them to Assessment.
- Finally, what format will you convert the information into? Your answers to Question #2 will help you determine the format that you will use. An infographic is best to present facts and concepts; if you want to use embedded audio or video, an interactive presentation works better.
Two easy-to-use infographic tools are Emaze and Piktochart. You can sign up for a free account, but keep in mind that it only gives you access to certain templates. You can still create some cool visual presentations and interactions with the free templates.
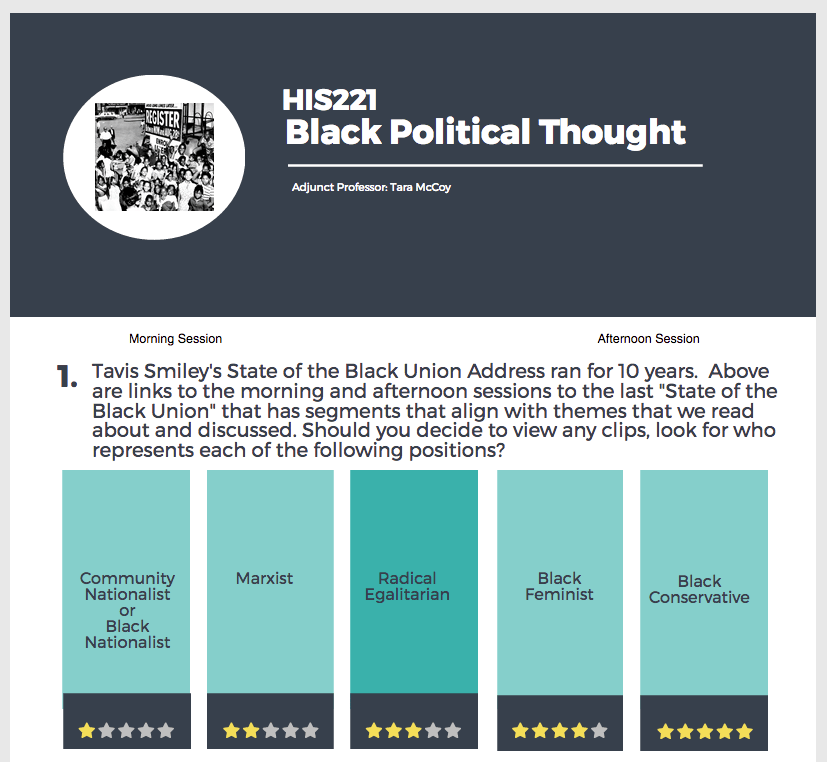
Below, I’ve shared two examples that I created using these free tools. In the first example, I created an infographic using a Piktochart. In my Black Political Thought infographic, I asked learners to connect how black ideologies and politics shape current American events and culture.
In the second example, I presented Great Peacemakers to the Trailblazers Toastmasters club. Rather than sharing handouts with globs of text, I used Emaze to create an interactive visual presentation to engage my audience throughout my presentation.
https://app.emaze.com/@AOCTQZWW/tnmj_tm8
My audience gave me great feedback with meaningful Glows and Grows (a reflection and assessment strategy meant to improve presentations).
This time you might use an infographic or interactive visual; the next time you may want to transition your content into an eLearning activity. In my next post, I’ll discuss how to use PowerPoint to create an interactive scenario.
References
Bannister, S. (2002). Developing Objectives and Relating them to Assessment. The Center for Teaching and Learning.
7 Things You Should Know About Infographic Creation Tools | EDUCAUSE CONNECT (01 February 2013) by Educause_learning_initiative


One thought on “Visual Tools: Convert Your Content into a Format That Pops”